Market Outlook
May 02, 2018
Market Cues
Domestic Indices
Chg (%)
(Pts)
(Cl ose)
Indian markets are likely to open flat tracking global indices and SGX Nifty.
BSE Sensex
0.5
191
35,160
U.S. Stocks turned mixed over the course of the trading day on Tuesday. While the
Nifty
0.4
47
10,739
Nasdaq and the S&P 500 climbed into positive territory, the Dow remained stuck in
Mid Cap
0.6
95
17,012
the red. The Dow Jones fell by 0.3 percent to 24,009 and the Nasdaq jumped by
Small Cap
0.9
162
18,402
0.9 percent to 7,130.
Bankex
0.4
122
28,652
U.K. stocks stock market is higher today and looks on course to end on a positive
note for the fourth successive session. The FTSE 100 was up by 0.4% to end at
Global Indices
Chg (%)
(Pts)
(Cl ose)
7,534.
Dow Jones
(0.3)
(65)
24,009
On domestic front, Indian shares rose during the last trading session, tracking firm
Nasdaq
0.9
65
7,130
cues from global markets as geopolitical tensions faded and investors looked ahead
FTSE
0.4
35
7,534
to a slew of U.S. data releases this week for hints on the interest rate outlook. The
Nikkei
0.7
148
22,468
BSE Sensex ended up by 0.5% at 35,160.
Hang Seng
1.7
528
30,808
News Analysis
Shanghai Com
0.2
7
3,082
M&M to acquire up to 10% stake in Canada's IT firm Resson Aerospace Corp
Addition of HDFC Bank in Top Picks
A dvances / Declines
BSE
NSE
Detailed analysis on Pg2
Advances
1,404
796
Declines
1,248
982
Investor’s Ready Reckoner
Unchanged
137
76
Key Domestic & Global Indicators
Stock Watch: Latest investment recommendations on 150+ stocks
Volumes (` Cr)
Refer Pg5 onwards
BSE
3,566
Top Picks
NSE
34,482
C MP
Target
U psi de
C ompany
Sector
R ating
(`)
(`)
(%)
Net Inflows (` Cr)
Ne t
Mtd
Ytd
Blue Star
Capital Goods Accumulate
801
867
8.2
Dewan Housi ng Finance
Financials
Buy
641
720
12.3
FII
(100)
(4,952)
8,655
Century Plyboards
Forest Product
Buy
326
400
22.7
*MFs
409
8,173
42,632
Navkar Corporation
Others
Buy
177
265
49.7
KEI Industrie s
Capital Goods Accumulate
437
485
11.1
Top Gainers
Price (`)
Chg (%)
More Top Picks on Pg4
IBVENTUREPP
299
10.0
Key Upcoming Events
IBREALEST
215
7.8
Previous
C onsensus
D ate
Region
Event Description
ReadingExpectations
REPCOHOME
643
7.7
May 02, 2018 US
FOMC rate decision
1.75
1.75
IBVENTURES
482
7.3
May 01, 2018 Germany PMI Manufacturing
58.10
58.10
GATI
121
7.1
May 02, 2018 Euro Zone Euro-Zone GDP s.a. (QoQ)
0.70
0.40
May 03, 2018 US
Change in N onfarm payrolls
103.00
195.00
Top Losers
Price (`)
Chg (%)
May 04, 2018 US
Initial Jobless claims
209.00
223.50
More Events on Pg7
PCJEWELLER
145
-18.5
VIDEOIND
10
-8.2
SREINFRA
86
-6.6
HDIL
33
-5.6
CANFINHOME
421
-5.3
As on April 30, 2018
Market Outlook
May 02, 2018
News Analysis
M&M to acquire up to 10% stake in Canada's IT firm Resson Aerospace
Corp
acquire up to 10 per cent share capital of Canada's IT firm Resson Aerospace
Corporation for up to CAD 6.63 million to be paid in cash. "The company has
signed a share subscription agreement for subscribing up to 8,00,402 Class C
preferred shares of Resson Aerospace Corporation, Canada, which would result in
the company holding up to 10 per cent of the share capital of Resson on a fully
diluted basis," M&M said in a regulatory filing.
M&M said the cost of acquisition is up to CAD 6.63 million (equivalent to
approximately Rs 354 million) to be paid in cash. Resson is focused on providing
technology solutions for agriculture. It has developed a system which captures and
interprets images to give farmers information about the state of their fields and
crops. It operates primarily in Canada and the US. According to reports, Resson
is expected to support its businesses by developing technology solutions for the
company's farm division.
Economic and Political News
Corporate News
Market Outlook
May 02, 2018
Quarterly Bloomberg Brokers Consensus Estimate
HCL Tech Ltd - May 02, 2018
Particulars ( ` cr)
4QFY18E
4QFY17
y-o-y (%)
3QFY18
q-o-q (%)
Sales
13200
12898
2.3
12809
3.1
EBIDTA
3028
2747
10.2
2789
8.6
%
22.9
21.3
21.8
PAT
2249
2474
9.1
2075
8.4
Hero Motocorp Ltd - May 02, 2018
Particulars ( ` cr)
4QFY18E
4QFY17
y-o-y (%)
3QFY18
q-o-q (%)
Sales
8542
6915
23.5
7305
16.9
EBIDTA
1379
958
43.9
1158
19.1
%
16.1
13.9
15.9
PAT
958
718
33.4
805
19.0
Siemens Ltd - May 02, 2018
Particulars ( ` cr)
2QFY18E
2QFY17
y-o-y (%)
1QFY18
q-o-q (%)
Sales
3204
2929
9.4
2429
31.9
EBIDTA
315
279
12.9
272
15.8
%
9.8
9.5
11.2
PAT
218
186
17.2
190
14.7
Tata Power Ltd - May 02, 2018
Particulars ( ` cr)
4QFY18E
4QFY17
y-o-y (%)
3QFY18
q-o-q (%)
Sales
7938
7167
10.8
6950
14.2
EBIDTA
1407
512
174.8
1209
16.3
%
17.7
7.1
17.4
PAT
469
(262)
279
649
(27.7)
Marico Ltd - May 02, 2018
Particulars ( ` cr)
4QFY18E
4QFY17
y-o-y (%)
3QFY18
q-o-q (%)
Sales
1525
1322
15.4
1624
(6.1)
EBIDTA
282
259
8.9
302
(6.6)
%
18.5
19.6
18.6
PAT
197
171
15.2
223
(11.7)
Market Outlook
May 02, 2018
Top Picks
Market Cap
C MP
Target
Upside
C ompany
R ationale
(` Cr)
(`)
(`)
(%)
Strong growth in domestic business due to its
leadership in acute therapeutic segment. Alkem
Alkem Laboratories
23,630
1,976
2,441
23.5
expects to launch more products in USA, which
bode s for its internati onal business.
Favorable outlook for the AC industry to augur well
for Cooling products business which is out pacing
Blue Star
7,692
801
867
8.2
the market growth. EMPPAC division's profitability
to improve once oper ating environme nt turns
around.
With a focus on the low and me dium income (LMI)
consumer se gment, the company has increase d its
Dewan Housi ng Finance
20,106
641
720
12.3
presence in tier-II & III cities where the growth
opportunity i s immense.
Well capitalized with CAR of 18.1% which give s
sufficient room to grow asset base. F aster re solution
ICICI Bank
182,855
284
416
46.2
of NPA would reduce provi sion cost, which would
help to re port better ROE.
High order book execution in EPC segment, rising
KEI Industrie s
3,421
437
485
11.1
B2C sales and hi gher exports to boost the revenue s
and profitability
Expected to benefit from the lower capex
Music Broadcast Limited
2,185
383
475
24.0
requirement and 15 year long radio broadcast
licensing.
Massive capacity expansion along with rail
Navkar Corporation
2,664
177
265
49.7
advantage at ICD as well CFS augur well for the
company
Strong brands and distribution network would boost
Siyaram Silk Mills
3,186
680
851
25.2
growth goi ng ahe ad. Stock currently trades at an
inexpensive valuation.
Market leadership in Hindi news genre and no. 2
viewership ranking in English news genre, exit from
TV Today Network
2,853
478
603
26.1
the radio busine ss, and anticipated growth in ad
spends by corporate to benefit the stock.
After GST, the company is expected to see higher
volume s along with improving product mix. The
Maruti
266,519
8,823
10,619
20.4
Gujarat plant will also enable higher operating
leverage which will be margin accretive.
We expect loan book to grow at 24.3% over next
GIC Housing
2,334
434
655
51.1
two year; change in borrowing mix will help in NIM
improve ment
We expect CPIL to report net Revenue/PAT CAGR of
~17%/ 16% over FY2017-20E mainly due to
Century Plyboards
7,242
326
400
22.7
healthy growth in plywood & lamination busine ss,
forayed into MDF & Particle boards on back of
strong brand & distribution network.
We expect sales/PAT to grow at 13.5%/ 20% over
LT Foods
2,922
91
128
40.1
next two years on the back of strong di stribution
network & addition of new products in portfolio.
Third large st brand play in luggage segment
Increase d product offerings and improvi ng
Safari Industries
1,490
670
750
12.0
distribution network is leading to strong growth in
busine ss. Likely to post robust growth for next 3-4
years
We expect HSIL to report PAT CAGR of ~15% over
FY2017-20E owing to better improve ment in
HSIL Ltd
2,727
377
510
35.2
operating margi n due price hi ke in container glass
segment, turnaround in consumer busine ss.
Source: Company, Angel Research
Market Outlook
May 02, 2018
Top Picks
Market Cap
C MP
Target
Upside
C ompany
R ationale
(` Cr)
(`)
(`)
(%)
We expect financialisation of savings and
Aditya Birla Capital
35151
160
230
43.0
increasing penetration in Insurance & Mutual fund
would ensure steady growth.
One of the leading Indian dairy products
companie s in India created strong brands in dairy
products. Rising revenue share of high-margin
Parag Milk F oods
2,562
305
333
9.1
Value Adde d Products and reducti on in interest cost
is likely to boost margins and e arnings in next few
years.
We expect MCL to report net revenue CAGR of
~15% to ~` 450cr over FY2018-20E mainly due to
strong growth in online matchmaking & marriage
Matrimony.com Ltd
1,916
844
984
16.6
related services. On the bottom-line front, we
expect a CAGR of ~28% to `82cr over the same
period on the back margin improve ment.
HDFC Bank maintaine d its steady growth in the
4QFY18. The bank’s net profit grew by
20.3%.
Steady growth in interest income and other income
HDFC Bank
5,05,007
1,944
2,315
19.1
aided PAT growth. The Strong liability franchise
and he althy capitalisation provi des strong earning
visibility. At the current market price, the bank is
trading at 3.2x FY20E ABV.
Source: Company, Angel Research
Fundamental Call
Market Cap
C MP
Target
Upside
C ompany
R ationale
(` Cr)
(`)
(`)
(%)
CCL is likely to maintain the strong growth trajectory
CCL Products
4,162
313
360
15.1
over FY18-20 backed by capacity expansion and
new geographical foray
We forecast Nilkamal to report top-line CAGR of
~9% to `2,635cr over FY17-20E on the back of
Nilkamal
2,547
1,707
2,178
27.6
healthy demand growth in plastic divi sion. On the
bottom-line front, we esti mate
~10% CAGR to
`162cr owing to improve ment in volumes.
The prism has diversified exposure in the different
segment such as Ceme nt, Tile & ready mix concrete.
Prism Cement
6,229
124
160
29.3
Thus we believe, PCL is in the right place to capture
ongoing government spendi ng on affordable
housing and infrastructure projects.
Elantas Beck India is the Indian market leader in
liquid insulation segment used in electrical
equipme nts like motors, transformers etc. It derives
Elantas Beck India Ltd
1,871
2,361
2,500
5.9
demand from several industries which are expected
to register 10%+ CAGR in demand in the coming
years.
Greenply Industries Ltd (GIL) manufactures plywood
& allied products and me dium density fibreboards
(MDF). GIL to report net revenue CAGR of ~14% to
Greenply Industries
3,787
309
395
27.9
~`2,478cr over FY2017-20E mainly due to healthy
growth in plyw ood & lamination busine ss on the
back of strong brand and di stribution network
GMM Pfaudler Limited (GMM) is the Indian market
leader in glass-lined (GL) steel equipment. GMM is
expected to cross CAGR 15%+ in revenue over the
GMM Pfaudler Ltd
4,046
780
861
10.4
next few years mainly led by uptick in demand from
user industries and it is also expecting to increase its
share of non-GL business to 50% by 2020.
Market Outlook
May 02, 2018
Key Upcoming Events
Result Calendar
Date
Company
May 02, 2018
Hero Motocorp, Siemens, Marico, HCL Tech, HT Media, Godawari Ispat, Tata Power Co., Interglobe Aviation
May 03, 2018
Hexaware, Sesa Goa, MRF, Adani Power, Radico Khaitan
Source: Bloomberg, Angel Research
Global economic events release calendar
Bloomberg Data
Date
Time
Country
Event Description
Unit
Period
Last Reported
Estimated
May 02, 2018
11:30 PMUS
FOMC rate decision
%
May 2
1.75
1.75
1:25 PMGermany PMI Manufacturing
Value
Apr F
58.10
58.10
2:30 PMEuro Zone Euro-Zone GDP s.a. (QoQ)
% Change
1Q A
0.70
0.40
May 03, 2018
6:00 PMUS
Change in Nonfarm payrolls
Thousands
Apr
103.00
195.00
May 04, 2018
6:00 PMUS
Initial Jobless claims
Thousands
Apr 28
209.00
223.50
1:25 PMGermany PMI Services
Value
Apr F
54.10
54.10
6:00 PMUS
Unnemployment rate
%
Apr
4.10
4.00
May 08, 2018
China
Exports YoY%
% Change
Apr
(2.70)
9.80
May 09, 2018
US
Producer Price Index (mom)
% Change
Apr
0.20
May 10, 2018
6:00 PMUS
Consumer price index (mom)
% Change
Apr
(0.10)
0.30
2:00 PMUK
Industrial Production (YoY)
% Change
Mar
2.20
7:00 AMChina
Consumer Price Index (YoY)
% Change
Apr
2.10
1.90
4:30 PMUK
BOE Announces rates
% Ratio
May 10
0.50
0.50
May 11, 2018
5:30 PMIndia
Industrial Production YoY
% Change
Mar
7.10
May 14, 2018
12:00 PMIndia
Monthly Wholesale Prices YoY%
% Change
Apr
2.47
Source: Bloomberg, Angel Research
Market Outlook
May 02, 2018
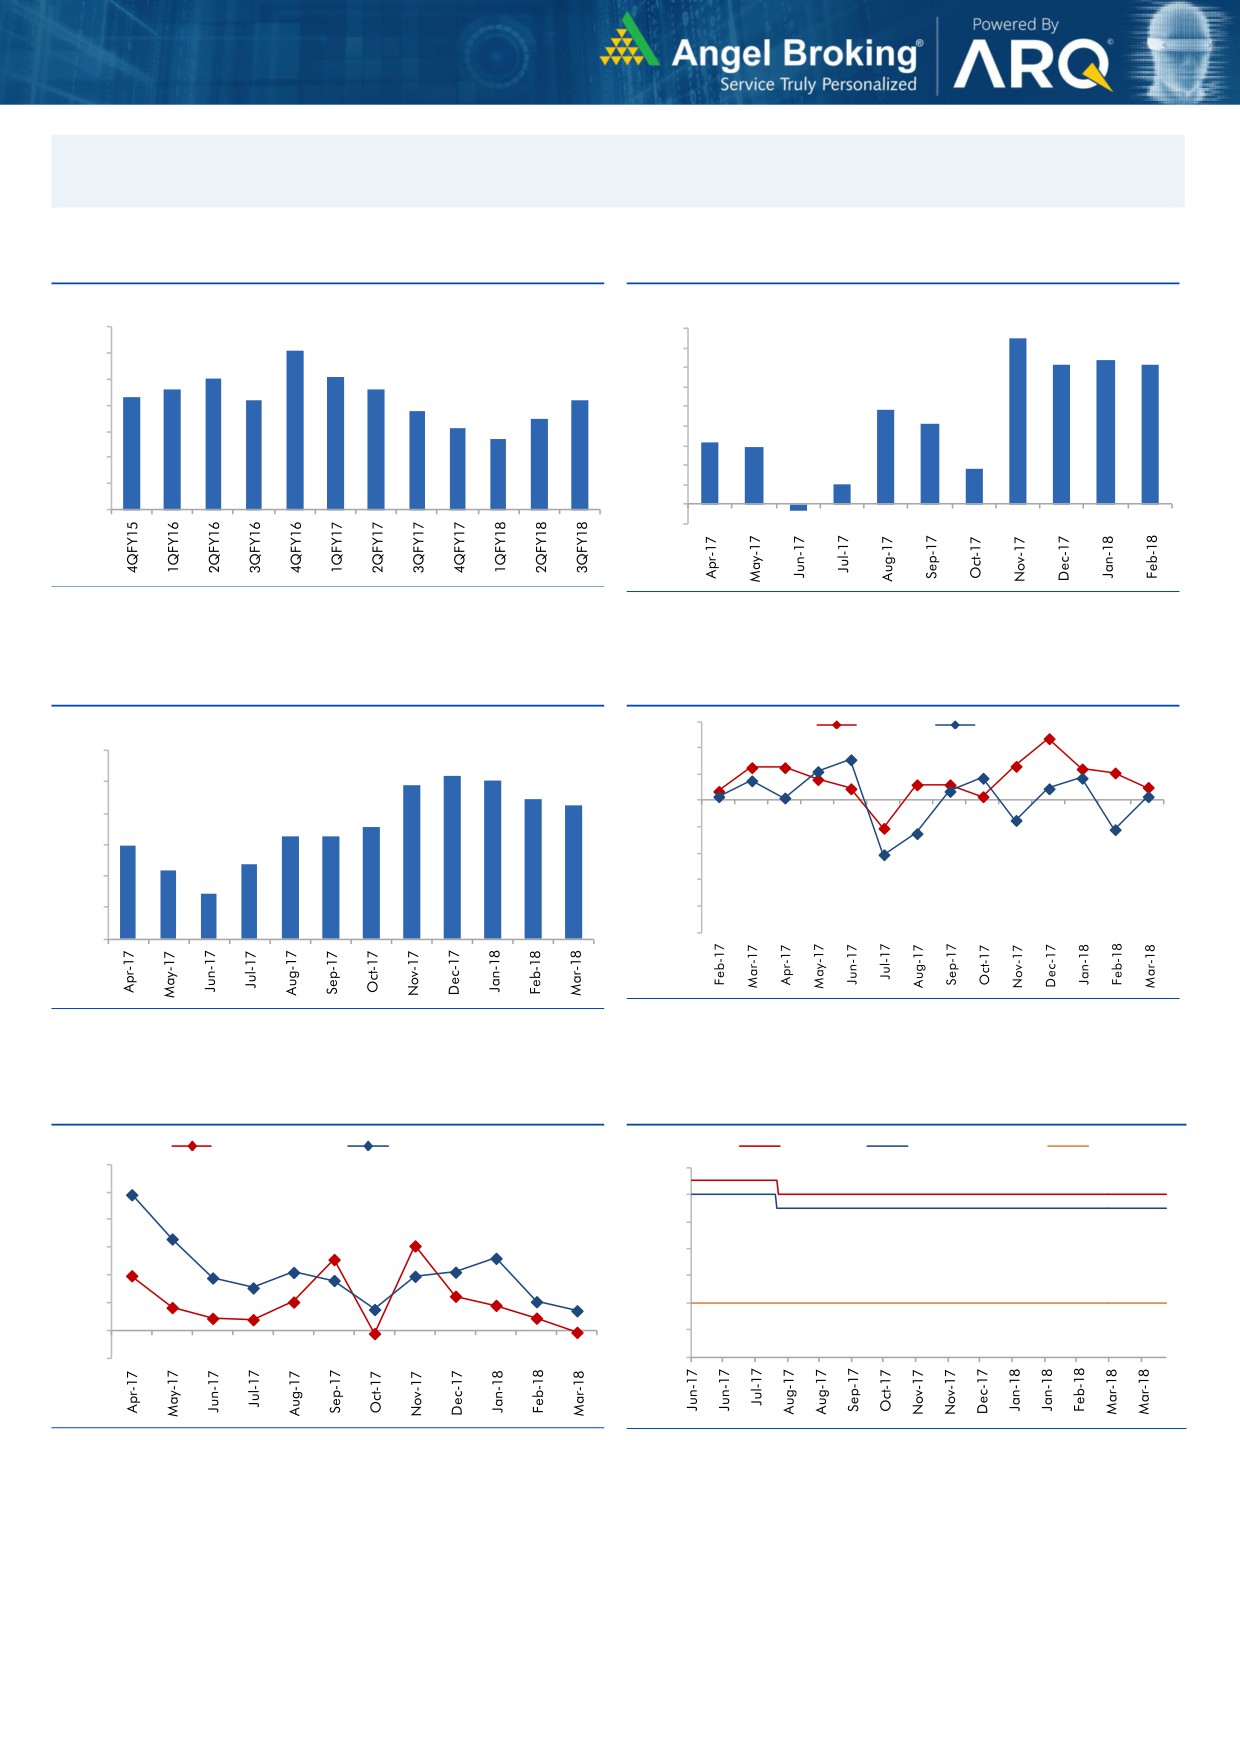
Macro watch
Exhibit 1: Quarterly GDP trends
Exhibit 2: IIP trends
(%)
(%)
8.5
10.0
9.0
9.1
7.4
9.0
8.0
7.1
7.1
8.0
8.1
7.0
7.6
7.6
8.0
7.3
7.2
7.2
6.0
6.8
4.8
7.0
6.5
5.0
4.1
6.1
5.7
4.0
3.2
6.0
2.9
3.0
1.8
5.0
2.0
1.0
4.0
1.0
-
3.0
(1.0)
(0.3)
Source: CSO, Angel Research
Source: MOSPI, Angel Research
Exhibit 3: Monthly CPI inflation trends
Exhibit 4: Manufacturing and services PMI
56.0
Mfg. PMI
Services PMI
(%)
6.0
54.0
5.2
5.1
4.9
52.0
5.0
4.4
4.3
50.0
4.0
3.6
3.3
3.3
3.0
48.0
3.0
2.4
2.2
46.0
2.0
1.5
44.0
1.0
42.0
40.0
-
Source: Market, Angel Research; Note: Level above 50 indicates expansion
Source: MOSPI, Angel Research
Exhibit 5: Exports and imports growth trends
Exhibit 6: Key policy rates
(%)
Exports yoy growth
Imports yoy growth
(%)
Repo rate
Reverse Repo rate
CRR
60.0
6.50
50.0
6.00
40.0
5.50
30.0
5.00
20.0
4.50
10.0
4.00
0.0
3.50
(10.0)
3.00
Source: Bloomberg, Angel Research
Source: RBI, Angel Research
Market Outlook
May 02, 2018
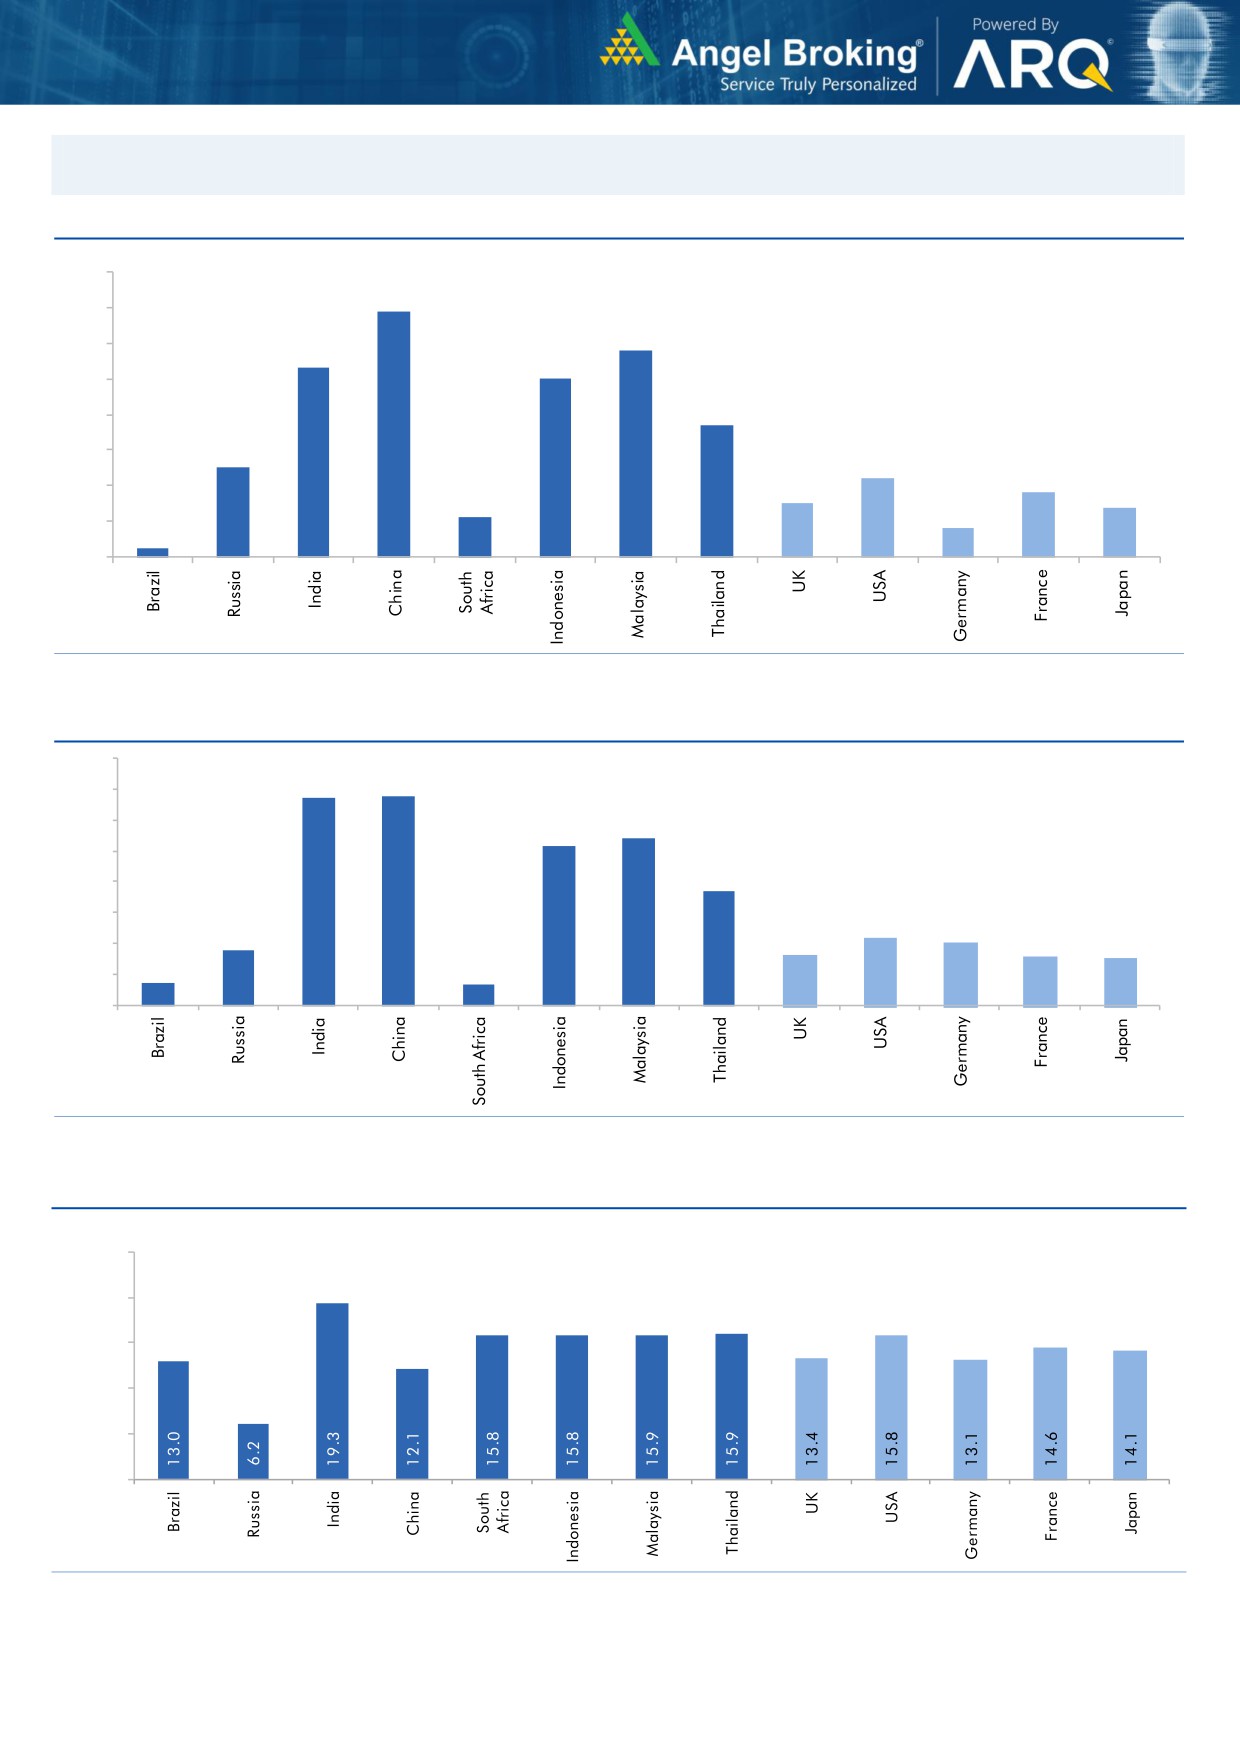
Global watch
Exhibit 1: Latest quarterly GDP Growth (%, yoy) across select developing and developed countries
(%)
8.0
6.9
7.0
5.8
6.0
5.3
5.0
5.0
1.1
3.7
4.0
2.5
3.0
2.2
1.8
2.0
1.5
1.4
0.8
1.0
0.3
-
Source: Bloomberg, Angel Research
Exhibit 2: 2017 GDP Growth projection by IMF (%, yoy) across select developing and developed countries
(%)
6.7
6.8
7.0
6.0
5.4
5.2
5.0
3.7
4.0
3.0
1.8
2.2
2.0
1.7
1.6
2.0
0.7
1.5
0.7
1.0
-
Source: IMF, Angel Research
Exhibit 3: One year forward P-E ratio across select developing and developed countries
(x)
25.0
20.0
15.0
10.0
5.0
-
Source: IMF, Angel Research as on 27 April, 2018
Market Outlook
May 02, 2018
Exhibit 4: Relative performance of indices across globe
Returns (%)
Country
Name of index
Closing price
1M
3M
1YR
Brazil
Bovespa
86,445
3.1
7.1
35.6
Russia
Micex
2,286
1.4
7.1
11.4
India
Nifty
10,692
5.5
(3.1)
14.8
China
Shanghai Composite
3,082
(1.6)
(11.3)
(2.8)
South Africa
Top 40
50,684
3.0
(6.4)
8.7
Mexico
Mexbol
48,285
3.0
(3.9)
(2.3)
Indonesia
LQ45
946
(4.2)
(14.9)
2.7
Malaysia
KLCI
1,863
0.3
1.4
7.2
Thailand
SET 50
1,178
(0.9)
(1.6)
18.4
USA
Dow Jones
24,311
1.9
(7.9)
16.1
UK
FTSE
7,502
8.9
(1.5)
3.5
Japan
Nikkei
22,468
6.8
(5.1)
21.9
Germany
DAX
12,581
5.1
(5.7)
0.6
France
CAC
5,483
7.4
(0.6)
1.1
Source: Bloomberg, Angel Research as on 27 April, 2018 68in4
Market Outlook
May 02, 2018
Research Team Tel: 022 - 39357800
DISCLAIMER
Angel Broking Private Limited (hereinafter referred to as “Angel”) is a registered Member of National Stock Exchange of India
Limited,Bombay Stock Exchange Limited and Metropolitan Stock Exchange Limited. It is also registered as a Depository Participant with
CDSL and Portfolio Manager with SEBI. It also has registration with AMFI as a Mutual Fund Distributor. Angel Broking Private Limited is
a registered entity with SEBI for Research Analyst in terms of SEBI (Research Analyst) Regulations, 2014 vide registration number
INH000000164. Angel or its associates has not been debarred/ suspended by SEBI or any other regulatory authority for accessing
/dealing in securities Market. Angel or its associates/analyst has not received any compensation / managed or co-managed public
offering of securities of the company covered by Analyst during the past twelve months.
This document is solely for the personal information of the recipient, and must not be singularly used as the basis of any investment
decision. Nothing in this document should be construed as investment or financial advice. Each recipient of this document should
make such investigations as they deem necessary to arrive at an independent evaluation of an investment in the securities of the
companies referred to in this document (including the merits and risks involved), and should consult their own advisors to determine
the merits and risks of such an investment.
Reports based on technical and derivative analysis center on studying charts of a stock's price movement, outstanding positions and
trading volume, as opposed to focusing on a company's fundamentals and, as such, may not match with a report on a company's
fundamentals. Investors are advised to refer the Fundamental and Technical Research Reports available on our website to evaluate the
contrary view, if any.
The information in this document has been printed on the basis of publicly available information, internal data and other reliable
sources believed to be true, but we do not represent that it is accurate or complete and it should not be relied on as such, as this
document is for general guidance only. Angel Broking Pvt. Limited or any of its affiliates/ group companies shall not be in any way
responsible for any loss or damage that may arise to any person from any inadvertent error in the information contained in this report.
Angel Broking Pvt. Limited has not independently verified all the information contained within this document. Accordingly, we cannot
testify, nor make any representation or warranty, express or implied, to the accuracy, contents or data contained within this document.
While Angel Broking Pvt. Limited endeavors to update on a reasonable basis the information discussed in this material, there may be
regulatory, compliance, or other reasons that prevent us from doing so.
This document is being supplied to you solely for your information, and its contents, information or data may not be reproduced,
redistributed or passed on, directly or indirectly.
Neither Angel Broking Pvt. Limited, nor its directors, employees or affiliates shall be liable for any loss or damage that may arise from
or in connection with the use of this information.